158人参与 • 2026-03-02 • https
操作步骤:
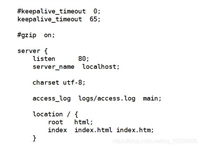
/etc/nginx/nginx.conf 或 /etc/nginx/conf.d/default.conf)。http 块内找到或添加 log_format 指令,自定义一个包含 $request_time 的格式。例如:http {
log_format main '$remote_addr - $remote_user [$time_local] "$request" '
'$status $body_bytes_sent "$http_referer" '
'"$http_user_agent" "$http_x_forwarded_for" '
'rt=$request_time uct="$upstream_connect_time" uht="$upstream_header_time" urt="$upstream_response_time"';
# 或者简单地在原有格式后追加 $request_time
access_log /var/log/nginx/access.log main;
}
nginx -t 测试语法,然后 nginx -s reload 重载配置。access.log,应该能看到每行末尾有 rt=0.123 这样的记录,这就是请求总耗时(单位:秒)。解释:
$request_time:从 nginx 接收客户端请求到发送完最后一个字节的总时间(包括与后端的通信)。$upstream_response_time:后端服务器处理请求的时间(从建立连接到收到响应的时间)。如果这个值很大而 $request_time 接近,说明后端处理慢;如果 $upstream_response_time 很小但 $request_time 很大,可能是网络传输或客户端接收慢。你的后端服务(如 java spring boot)通常会记录每个请求的处理时间。例如:
@responsebody 等)。在服务器上或另一台机器上,用 curl 模拟两个模块的请求,观察总耗时:
# 模拟用户信息模块的请求
curl -o /dev/null -s -w "用户信息耗时: %{time_total}s\n" "http://你的后端ip:端口/video下载接口?参数=用户信息的值"

# 模拟信贷信息模块的请求
curl -o /dev/null -s -w "信贷信息耗时: %{time_total}s\n" "http://你的后端ip:端口/video下载接口?参数=信贷信息的值"
比较两者的耗时。如果用户信息模块的耗时远大于信贷模块,说明问题在于该请求的处理本身就慢,导致客户端超时。
由于 http 499 是客户端主动断开,结合“信贷模块正常、用户模块 499”,重点检查:
timeout(如 axios 的 timeout: 30000 30秒),而信贷模块可能未设置或设置较长。如果请求耗时超过 30 秒,前端就会断开。如果不想修改全局日志格式,也可以临时在特定的 location 或 server 块中配置一个带耗时的访问日志,例如:
server {
    listen 80;
    server_name example.com;
    access_log /var/log/nginx/api_access.log upstream_time;

    location /your-download-api {
        # ...
    }
}
但更推荐统一配置以便长期监控。
以上就是接口服务在nginx中提示http 499问题的排查步骤的详细内容,更多关于接口服务nginx提示http 499的资料请关注代码网其它相关文章!
您想发表意见!!点此发布评论
版权声明:本文内容由互联网用户贡献,该文观点仅代表作者本人。本站仅提供信息存储服务,不拥有所有权,不承担相关法律责任。 如发现本站有涉嫌抄袭侵权/违法违规的内容, 请发送邮件至 2386932994@qq.com 举报,一经查实将立刻删除。


发表评论