prometheus监控nginx的实现步骤
69人参与 • 2026-05-09 • Mysql
方式一:nginx-module-vts 方式(推荐,无需额外 exporter)
1. 环境准备与依赖安装
# 1. 安装基础依赖
yum -y install gcc-c++ pcre pcre-devel zlib zlib-devel openssl openssl-devel git wget
# 2. 创建工作目录
mkdir -p /opt/nginx-install && cd /opt/nginx-install
# 3. 下载 nginx 1.24.0 和 nginx-module-vts 模块
wget http://nginx.org/download/nginx-1.24.0.tar.gz
git clone git://github.com/vozlt/nginx-module-vts.git
# 4. 解压 nginx 源码包
tar -zxvf nginx-1.24.0.tar.gz
mv nginx-module-vts /usr/local/nginx-module-vts
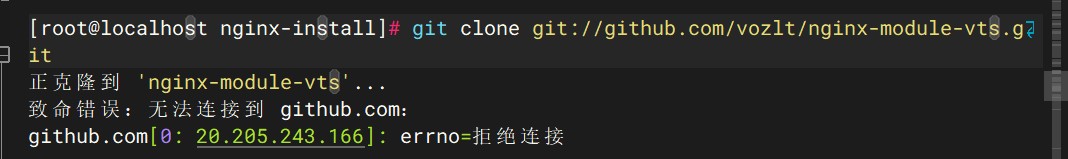
github 的 git 协议(git://)可能被防火墙拦截,换成 https 协议,同时使用国内镜像源(如 github 镜像站):
# 1. 先删除失败的空目录(如果有)
rm -rf nginx-module-vts
# 2. 使用 https 协议克隆(优先)
git clone https://github.com/vozlt/nginx-module-vts.git
# 如果依然失败,使用国内镜像站(如 gitee 镜像)
git clone https://gitee.com/mirrors/nginx-module-vts.git
2. 编译安装 nginx(带 vts 模块)
# 进入 nginx 源码目录
cd /opt/nginx-install/nginx-1.24.0
# 配置编译参数(指定安装路径 + 加载 vts 模块)
./configure --prefix=/usr/local/nginx --add-module=/usr/local/nginx-module-vts/
# 编译并安装(-j 后接cpu核心数,加快编译速度,比如 -j4)
make -j4 && make install
# 验证模块是否加载成功
/usr/local/nginx/sbin/nginx -v | grep nginx-module-vts
# 输出包含 --add-module=/usr/local/nginx-module-vts/ 即表示成功
3. 配置 nginx 开启状态监控
# 备份原有配置文件
cp /usr/local/nginx/conf/nginx.conf /usr/local/nginx/conf/nginx.conf.bak
# 编辑 nginx 主配置文件
cat > /usr/local/nginx/conf/nginx.conf << 'eof'
worker_processes 1;
events {
worker_connections 1024;
}
http {
include mime.types;
default_type application/octet-stream;
# 开启 vts 状态监控区域
vhost_traffic_status_zone;
sendfile on;
keepalive_timeout 65;
server {
listen 80;
server_name localhost;
# 配置状态监控接口
location /status {
vhost_traffic_status_display;
vhost_traffic_status_display_format html;
}
location / {
root html;
index index.html index.htm;
}
error_page 500 502 503 504 /50x.html;
location = /50x.html {
root html;
}
}
}
eof
# 启动/重启 nginx
/usr/local/nginx/sbin/nginx -t # 验证配置文件
/usr/local/nginx/sbin/nginx # 启动
# 如果已启动,执行重启:/usr/local/nginx/sbin/nginx -s reload
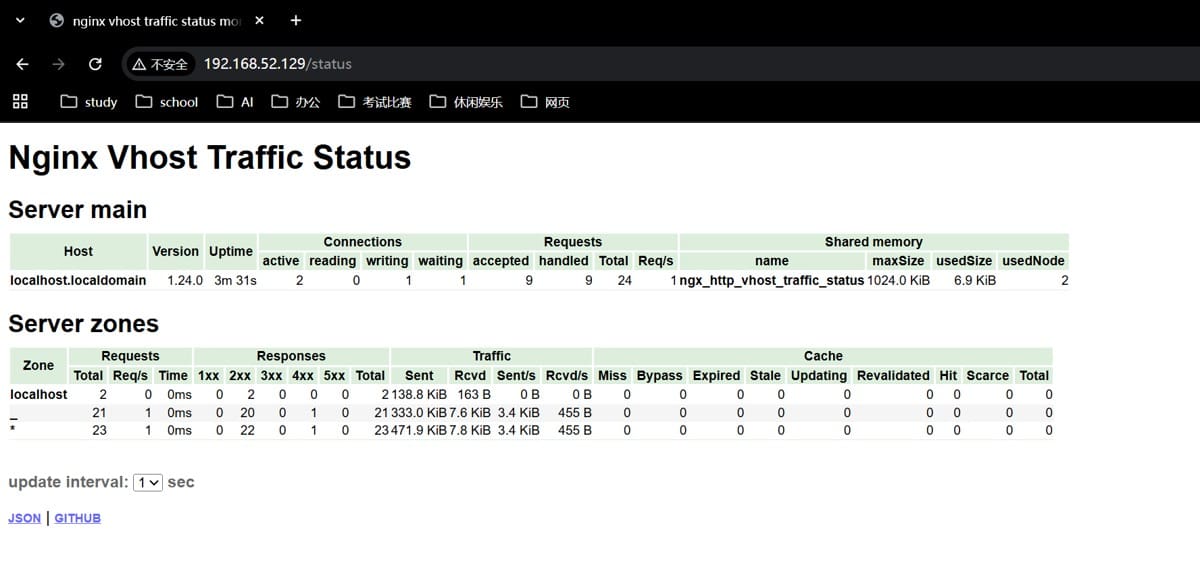
# 验证状态页面是否可访问
curl http://172.16.213.29/status # 查看 html 格式状态
curl http://172.16.213.29/status/format/prometheus # 查看 prometheus 格式指标4. 配置 prometheus 采集 nginx 指标
# 备份 prometheus 配置文件
cp /usr/local/prometheus/prometheus.yml /usr/local/prometheus/prometheus.yml.bak
# 编辑 prometheus 配置,添加 nginx 采集任务
sed -i '/scrape_configs:/a\  - job_name: "nginx"\n    metrics_path: /status/format/prometheus\n    static_configs:\n      - targets: ["172.16.213.29"]' /usr/local/prometheus/prometheus.yml
# 验证配置文件
/usr/local/prometheus/promtool check config /usr/local/prometheus/prometheus.yml
# 重启 prometheus(根据你的启动方式选择,以下是 systemd 方式示例)
systemctl restart prometheus
# 如果是直接启动,先杀死进程再重启:
# ps -ef | grep prometheus | grep -v grep | awk '{print $2}' | xargs kill
# /usr/local/prometheus/prometheus --config.file=/usr/local/prometheus/prometheus.yml &
方式二:nginx-prometheus-exporter 方式(官方推荐,更简单)
1. 确保 nginx 已开启 stub_status 模块
# 编辑 nginx 配置,开启 stub_status
cp /usr/local/nginx/conf/nginx.conf /usr/local/nginx/conf/nginx.conf.bak
sed -i '/server {/a\        location /basic_status {\n            stub_status on;\n            allow 127.0.0.1;\n            allow 172.16.213.0/24;\n            deny all;\n        }' /usr/local/nginx/conf/nginx.conf
# 验证配置并重启
/usr/local/nginx/sbin/nginx -t
/usr/local/nginx/sbin/nginx -s reload
# 验证 stub_status 是否可用
curl http://172.16.213.29/basic_status
# 正常输出示例:
# active connections: 1
# server accepts handled requests
#  1 1 1
# reading: 0 writing: 1 waiting: 0
2. 用 docker 运行 nginx-prometheus-exporter
# 拉取官方镜像
docker pull nginx/nginx-prometheus-exporter:latest
# 启动 exporter(关联 nginx 的 stub_status 地址)
docker run -d --name nginx-exporter \
  -p 9113:9113 \
  nginx/nginx-prometheus-exporter:latest \
  --nginx.scrape-uri=http://172.16.213.29/basic_status
# 验证 exporter 是否正常输出指标
curl http://172.16.213.29:9113/metrics
3. 配置 prometheus 采集 exporter 指标
# 编辑 prometheus 配置,添加 exporter 采集任务
sed -i '/scrape_configs:/a\  - job_name: "nginx-exporter"\n    static_configs:\n      - targets: ["172.16.213.29:9113"]' /usr/local/prometheus/prometheus.yml
# 验证配置并重启 prometheus
/usr/local/prometheus/promtool check config /usr/local/prometheus/prometheus.yml
systemctl restart prometheus
总结
- nginx-module-vts 方式:无需额外运行 exporter,直接通过 nginx 自身模块暴露 prometheus 格式指标,指标更丰富(支持虚拟主机、upstream 等)。
- nginx-prometheus-exporter 方式:官方维护,部署更简单,仅依赖 nginx 原生的 stub_status 模块,适合基础监控需求。
- 核心验证步骤:确保 nginx 状态接口可访问 → prometheus 配置正确 → prometheus 页面能看到
nginx或nginx-exporter任务状态为up。
执行完上述命令后,你可以在 prometheus web ui(默认 http://prometheus服务器ip:9090)的「targets」页面查看 nginx 采集任务是否正常,也可以通过「graph」页面查询 nginx 相关指标(如 nginx_connections_active、nginx_requests_total 等)。
正确的验证操作
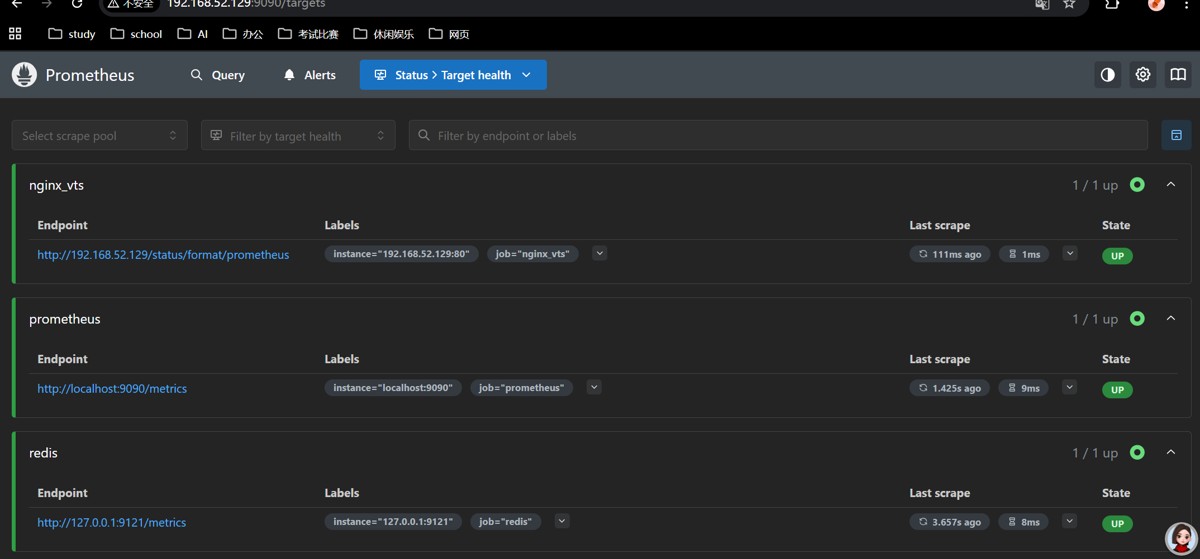
1. 用浏览器访问 prometheus ui
在你的电脑(能访问 192.168.52.129 的机器)上打开浏览器,输入:http://192.168.52.129:9090/targets
- 你会看到 prometheus 的 targets 页面,里面会列出 3 个采集任务:
prometheus、redis、nginx_vts - 检查
nginx_vts的状态:- 如果显示up:说明采集成功
- 如果显示down:大概率是 prometheus 访问 nginx 时的网络问题(但你 curl 能通,大概率是 up)
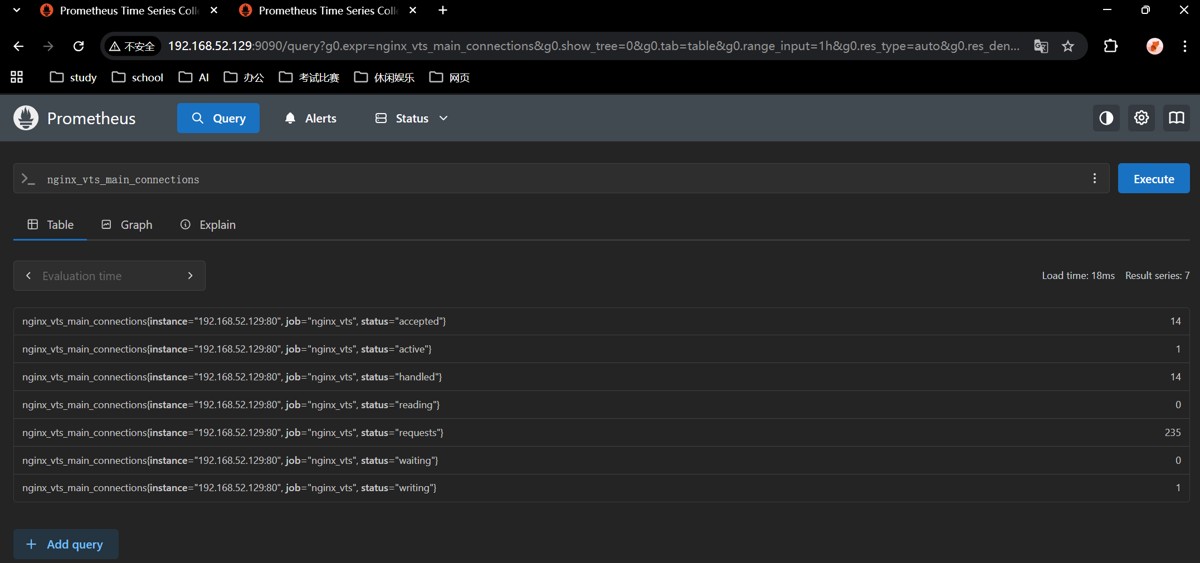
2. 验证是否采集到 nginx 指标
在浏览器中访问:http://192.168.52.129:9090/graph
- 在输入框中输入指标名:
nginx_vts_main_connections - 点击
execute按钮,就能看到 nginx 的连接数指标数据(如果能看到,说明采集成功)
到此这篇关于prometheus监控nginx的实现步骤的文章就介绍到这了,更多相关prometheus监控nginx内容请搜索代码网以前的文章或继续浏览下面的相关文章希望大家以后多多支持代码网!
赞 (0)
您想发表意见!!点此发布评论


发表评论