WPF实现绘制饼状统计图的示例代码
533人参与 • 2024-10-21 • Windows Phone
wpf 实现饼状统计图
- 框架支持
.net4 至 .net8; visual studio 2022;
chartpie 详解
新增依赖属性 datas 存储饼图的数据,当数据发生更改时触发控件的重绘。
构造初始化颜色组 (vibrantcolors) 为了区分每个扇形区显示不同的颜色。
绘制饼图
var drawingpen = createpen(2);
var bolddrawingpen = createpen(4);
var piewidth = actualwidth > actualheight ? actualheight : actualwidth;
var pieheight = actualwidth > actualheight ? actualheight : actualwidth;
centerx = piewidth / 2;
centery = pieheight / 2;
radius = actualwidth > actualheight ? actualheight / 2 : actualwidth / 2;
- 计算饼图的宽度和高度,以确保饼图是圆形的。
- 计算圆心与半径。
绘制每个扇形
var angle = 0d;
var prevangle = 0d;
var sum = datas.select(ser => ser.value).sum();
var index = 0;
var isfirst = false;
foreach (var item in datas)
{
    // 计算起始和结束角度
    var arcstartx = radius * math.cos(angle * math.pi / 180) + centerx;
    var arcstarty = radius * math.sin(angle * math.pi / 180) + centery;
    angle = item.value / sum * 360 + prevangle;
    var arcendx = 0d;
    var arcendy = 0d;
    if (datas.count() == 1 && angle == 360)
    {
        isfirst = true;
        arcendx = centerx + math.cos(359.99999 * math.pi / 180) * radius;
        arcendy = radius * math.sin(359.99999 * math.pi / 180) + centery;
    }
    else
    {
        arcendx = centerx + math.cos(angle * math.pi / 180) * radius;
        arcendy = radius * math.sin(angle * math.pi / 180) + centery;
    }

    var startpoint = new point(arcstartx, arcstarty);
    var line1segment = new linesegment(startpoint, false);
    var islargearc = item.value / sum > 0.5;
    var arcsegment = new arcsegment
    {
        size = new size(radius, radius),
        point = new point(arcendx, arcendy),
        sweepdirection = sweepdirection.clockwise,
        islargearc = islargearc
    };
    var center = new point(centerx, centery);
    var line2segment = new linesegment(center, false);
    var pathgeometry = new pathgeometry(new[]
    {
        new pathfigure(center, new list<pathsegment>
        {
            line1segment,
            arcsegment,
            line2segment
        }, true)
    });

    pathgeometries.add(pathgeometry,
        $"{item.key} : {item.value.formatnumber()}");

    var backgroupbrush = new solidcolorbrush
    {
        color = vibrantcolors[
            index >= vibrantcolors.length
                ? index % vibrantcolors.length
                : index]
    };
    backgroupbrush.freeze();
    drawingcontext.drawgeometry(backgroupbrush, null, pathgeometry);

    index++;
    if (!isfirst)
    {
        if (index == 1)
            drawingcontext.drawline(bolddrawingpen, center, startpoint);
        else
            drawingcontext.drawline(drawingpen, center, startpoint);
    }
    prevangle = angle;
}
- 初始化角度
angle和prevangle,计算数据总和(sum)。 - 循环
datas集合,计算每条数据所需占的扇形区的起始角度和结束的角度。 - 如果只有一条数据那么角度为
360度,然后绘制圆形。 - 使用
arcsegment绘制圆形的弧度,连接圆心和扇形区边缘。 - 将生成的
pathgeometry添加到pathgeometries中,并绘制每个的扇形区。 - 绘制每个扇形区的边框,根据索引设置画笔的宽度用于边框。
- 更新
prevangle以用于计算下一个扇形区的角度。
1)新增 chartpie.cs 代码如下:
using system;
using system.collections.generic;
using system.linq;
using system.windows;
using system.windows.controls;
using system.windows.controls.primitives;
using system.windows.input;
using system.windows.media;
using system.windows.media.effects;
using system.windows.shapes;
using wpfdevelopers.core;

namespace wpfdevelopers.controls
{
    public class chartpie : control
    {
        public static readonly dependencyproperty datasproperty =
            dependencyproperty.register("datas", typeof(ienumerable<keyvaluepair<string, double>>),
                typeof(chartpie), new uipropertymetadata(dataschanged));

        private border _border;
        private ellipse _ellipse;
        private keyvaluepair<pathgeometry, string> _lastitem;
        private popup _popup;
        private stackpanel _stackpanel;
        private textblock _textblock;
        private double centerx, centery, radius;
        private bool ispopupopen;
        private readonly dictionary<pathgeometry, string> pathgeometries = new dictionary<pathgeometry, string>();

        private readonly color[] vibrantcolors;

        public chartpie()
        {
            vibrantcolors = new[]
            {
                color.fromargb(255, 84, 112, 198),
                color.fromargb(255, 145, 204, 117),
                color.fromargb(255, 250, 200, 88),
                color.fromargb(255, 238, 102, 102),
                color.fromargb(255, 115, 192, 222),
                color.fromargb(255, 59, 162, 114),
                color.fromargb(255, 252, 132, 82),
                color.fromargb(255, 154, 96, 180),
                color.fromargb(255, 234, 124, 204)
            };
        }

        public ienumerable<keyvaluepair<string, double>> datas
        {
            get => (ienumerable<keyvaluepair<string, double>>) getvalue(datasproperty);
            set => setvalue(datasproperty, value);
        }

        private static void dataschanged(dependencyobject d, dependencypropertychangedeventargs e)
        {
            var ctrl = d as chartpie;
            if (e.newvalue != null)
                ctrl.invalidatevisual();
        }

        protected override void onmousemove(mouseeventargs e)
        {
            base.onmousemove(e);
            if (datas == null || datas.count() == 0 || ispopupopen) return;
            if (_popup == null)
            {
                _popup = new popup
                {
                    allowstransparency = true,
                    placement = placementmode.mousepoint,
                    placementtarget = this,
                    staysopen = false
                };
                _popup.mousemove += (y, j) =>
                {
                    var point = j.getposition(this);
                    if (ispopupopen && _lastitem.value != null)
                        if (!ismouseovergeometry(_lastitem.key))
                        {
                            _popup.isopen = false;
                            ispopupopen = false;
                            _lastitem = new keyvaluepair<pathgeometry, string>();
                        }
                };
                _popup.closed += delegate { ispopupopen = false; };

                _textblock = new textblock
                {
                    horizontalalignment = horizontalalignment.center,
                    verticalalignment = verticalalignment.center,
                    foreground = (brush) application.current.tryfindresource("wd.windowforegroundcolorbrush"),
                    padding = new thickness(4, 0, 2, 0)
                };
                _ellipse = new ellipse
                {
                    width = 10,
                    height = 10,
                    stroke = brushes.white
                };
                _stackpanel = new stackpanel {orientation = orientation.horizontal};
                _stackpanel.children.add(_ellipse);
                _stackpanel.children.add(_textblock);

                _border = new border
                {
                    child = _stackpanel,
                    background = (brush) application.current.tryfindresource("wd.chartfillsolidcolorbrush"),
                    effect = application.current.tryfindresource("wd.popupshadowdepth") as dropshadoweffect,
                    margin = new thickness(10),
                    cornerradius = new cornerradius(3),
                    padding = new thickness(6)
                };
                _popup.child = _border;
            }

            var index = 0;
            foreach (var pathgeometry in pathgeometries)
            {
                if (ismouseovergeometry(pathgeometry.key))
                {
                    ispopupopen = true;
                    _ellipse.fill = new solidcolorbrush
                    {
                        color = vibrantcolors[index >= vibrantcolors.length ? index % vibrantcolors.length : index]
                    };
                    _textblock.text = pathgeometry.value;
                    _popup.isopen = true;
                    _lastitem = pathgeometry;
                    break;
                }

                index++;
            }
        }

        private bool ismouseovergeometry(pathgeometry pathgeometry)
        {
            var mouseposition = mouse.getposition(this);
            return pathgeometry.fillcontains(mouseposition);
        }

        protected override void onrender(drawingcontext drawingcontext)
        {
            base.onrender(drawingcontext);
            if (datas == null || datas.count() == 0)
                return;
            snapstodevicepixels = true;
            uselayoutrounding = true;
            pathgeometries.clear();
            var drawingpen = createpen(2);
            var bolddrawingpen = createpen(4);
            var piewidth = actualwidth > actualheight ? actualheight : actualwidth;
            var pieheight = actualwidth > actualheight ? actualheight : actualwidth;
            centerx = piewidth / 2;
            centery = pieheight / 2;
            radius = actualwidth > actualheight ? actualheight / 2 : actualwidth / 2;
            var angle = 0d;
            var prevangle = 0d;
            var sum = datas.select(ser => ser.value).sum();
            var index = 0;
            var isfirst = false;
            foreach (var item in datas)
            {
                var arcstartx = radius * math.cos(angle * math.pi / 180) + centerx;
                var arcstarty = radius * math.sin(angle * math.pi / 180) + centery;
                angle = item.value / sum * 360 + prevangle;
                var arcendx = 0d;
                var arcendy = 0d;
                if (datas.count() == 1 && angle == 360)
                {
                    isfirst = true;
                    arcendx = centerx + math.cos(359.99999 * math.pi / 180) * radius;
                    arcendy = radius * math.sin(359.99999 * math.pi / 180) + centery;
                }
                else
                {
                    arcendx = centerx + math.cos(angle * math.pi / 180) * radius;
                    arcendy = radius * math.sin(angle * math.pi / 180) + centery;
                }

                var startpoint = new point(arcstartx, arcstarty);
                var line1segment = new linesegment(startpoint, false);
                var islargearc = item.value / sum > 0.5;
                var arcsegment = new arcsegment();
                var size = new size(radius, radius);
                var endpoint = new point(arcendx, arcendy);
                arcsegment.size = size;
                arcsegment.point = endpoint;
                arcsegment.sweepdirection = sweepdirection.clockwise;
                arcsegment.islargearc = islargearc;
                var center = new point(centerx, centery);
                var line2segment = new linesegment(center, false);

                var pathgeometry = new pathgeometry(new[]
                {
                    new pathfigure(new point(centerx, centery), new list<pathsegment>
                    {
                        line1segment,
                        arcsegment,
                        line2segment
                    }, true)
                });
                pathgeometries.add(pathgeometry,
                    $"{item.key} : {item.value.formatnumber()}");
                var backgroupbrush = new solidcolorbrush
                {
                    color = vibrantcolors[
                        index >= vibrantcolors.length
                            ? index % vibrantcolors.length
                            : index]
                };
                backgroupbrush.freeze();

                drawingcontext.drawgeometry(backgroupbrush, null, pathgeometry);
                index++;
                if (!isfirst)
                {
                    if (index == 1)
                        drawingcontext.drawline(bolddrawingpen, center, startpoint);
                    else
                        drawingcontext.drawline(drawingpen, center, startpoint);
                }

                prevangle = angle;
            }
        }

        private pen createpen(double thickness)
        {
            var pen = new pen
            {
                thickness = thickness,
                brush = brushes.white
            };
            pen.freeze();
            return pen;
        }
    }
}
2)新增 chartpieexample.xaml 示例代码如下:
        <grid background="{dynamicresource wd.backgroundsolidcolorbrush}">
            <grid.rowdefinitions>
                <rowdefinition />
                <rowdefinition height="auto" />
            </grid.rowdefinitions>
            <scrollviewer horizontalscrollbarvisibility="auto" verticalscrollbarvisibility="auto">
                <border
                    height="300"
                    margin="30,0"
                    background="{dynamicresource wd.backgroundsolidcolorbrush}">
                    <wd:chartpie datas="{binding datas, relativesource={relativesource ancestortype=local:chartpieexample}}" />
                </border>
            </scrollviewer>
            <button
                grid.row="1"
                width="200"
                verticalalignment="bottom"
                click="button_click"
                content="刷新"
                style="{staticresource wd.primarybutton}" />
        </grid>
3)新增 chartpieexample.xaml.cs 示例代码如下:
using system.collections.generic;
using system.linq;
using system.windows;
using system.windows.controls;

namespace wpfdevelopers.samples.exampleviews
{
    /// <summary>
    /// chartpieexample.xaml 的交互逻辑
    /// </summary>
    public partial class chartpieexample : usercontrol
    {
        public ienumerable<keyvaluepair<string, double>> datas
        {
            get { return (ienumerable<keyvaluepair<string, double>>)getvalue(datasproperty); }
            set { setvalue(datasproperty, value); }
        }

        public static readonly dependencyproperty datasproperty =
            dependencyproperty.register("datas", typeof(ienumerable<keyvaluepair<string, double>>), typeof(chartpieexample), new propertymetadata(null));

        private dictionary<string, ienumerable<keyvaluepair<string, double>>> keyvalues = new dictionary<string, ienumerable<keyvaluepair<string, double>>>();
        private int _index = 0;
        public chartpieexample()
        {
            initializecomponent();
            var models1 = new[]
            {
                new keyvaluepair<string, double>("mon", 120),
                new keyvaluepair<string, double>("tue", 530),
                new keyvaluepair<string, double>("wed", 1060),
                new keyvaluepair<string, double>("thu", 140),
                new keyvaluepair<string, double>("fri", 8000.123456) ,
                new keyvaluepair<string, double>("sat", 200) ,
                new keyvaluepair<string, double>("sun", 300) ,
            };
            var models2 = new[]
            {
                new keyvaluepair<string, double>("bing", 120),
                new keyvaluepair<string, double>("google", 170),
                new keyvaluepair<string, double>("baidu", 30),
                new keyvaluepair<string, double>("github", 200),
                new keyvaluepair<string, double>("stack overflow", 100) ,
                new keyvaluepair<string, double>("runoob", 180) ,
                new keyvaluepair<string, double>("open ai", 90) ,
                new keyvaluepair<string, double>("open ai2", 93) ,
                new keyvaluepair<string, double>("open ai3", 94) ,
                new keyvaluepair<string, double>("open ai4", 95) ,
            };
            keyvalues.add("1", models1);
            keyvalues.add("2", models2);
            datas = models1;
        }

        private void button_click(object sender, routedeventargs e)
        {
            _index++;
            if (_index >= keyvalues.count)
            {
                _index = 0;
            }
            datas = keyvalues.tolist()[_index].value;
        }
    }
}
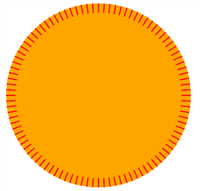
效果图
以上就是wpf实现绘制饼状统计图的示例代码的详细内容,更多关于wpf绘制饼状统计图的资料请关注代码网其它相关文章!
赞 (0)
您想发表意见!!点此发布评论

发表评论